OLAP in financial management. OLAP technology Application olap
The concept of multidimensional data analysis is closely associated with operational analysis, which is performed using OLAP systems.
OLAP (On-Line Analytical Processing) is a technology for operational analytical data processing that uses methods and tools for collecting, storing and analyzing multidimensional data to support decision-making processes.
The main purpose of OLAP systems is to support analytical activities and arbitrary (the term ad-hoc is often used) requests from user analysts. The purpose of OLAP analysis is to test emerging hypotheses.
At the origins of OLAP technology is the founder of the relational approach, E. Codd. In 1993, he published an article entitled "OLAP for User Analysts: What It Should Be." This paper outlines the basic concepts of online analytics and identifies the following 12 requirements that must be met by products that enable online analytics. Tokmakov G.P. Database. Database concept, relational data model, SQL languages. P. 51
Listed below are the 12 rules outlined by Codd that define OLAP.
1. Multidimensionality -- an OLAP system at the conceptual level should present data in the form of a multidimensional model, which simplifies the processes of analysis and perception of information.
2. Transparency -- the OLAP system must hide from the user the real implementation of the multidimensional model, the method of organization, sources, processing and storage means.
3. Availability -- An OLAP system must provide the user with a single, consistent and holistic data model, providing access to data regardless of how or where it is stored.
4. Consistent performance when developing reports - the performance of OLAP systems should not decrease significantly as the number of dimensions on which analysis is performed increases.
5. Client-server architecture -- the OLAP system must be able to work in a client-server environment, because Most of the data that today needs to be subjected to operational analytical processing is stored distributedly. The main idea here is that the server component of the OLAP tool should be sufficiently intelligent and allow the construction of a common conceptual scheme based on the generalization and consolidation of various logical and physical schemes of corporate databases to provide the effect of transparency.
6. Dimensional equality -- The OLAP system must support a multidimensional model in which all dimensions are equal. If necessary additional characteristics can be given to individual dimensions, but this capability must be given to any dimension.
7. Dynamic management of sparse matrices -- the OLAP system must provide optimal processing of sparse matrices. The access speed must be maintained regardless of the location of the data cells and be constant for models with different numbers of dimensions and varying degrees of data sparsity.
8. Support for multi-user mode - the OLAP system must provide the ability for several users to work together with one analytical model or create different models for them from single data. In this case, both reading and writing data is possible, so the system must ensure its integrity and security.
9. Unlimited cross operations -- the OLAP system must ensure that the functional relationships described using a certain formal language between the cells of the hypercube are preserved when performing any slice, rotation, consolidation or drill-down operations. The system should independently (automatically) perform the transformation of established relationships, without requiring the user to redefine them.
10. Intuitive data manipulation -- An OLAP system must provide a way to perform slicing, rotating, consolidating, and drilling operations on a hypercube without the user having to do a lot of interface manipulation. The dimensions defined in the analytical model must contain all the necessary information to perform the above operations.
11. Flexible options for obtaining reports -- the OLAP system must support various methods of data visualization, i.e. reports should be presented in any possible orientation. Reporting tools must present synthesized data or information resulting from the data model in any possible orientation. This means that rows, columns or pages must show 0 to N dimensions at a time, where N-- number measurements of the entire analytical model. Additionally, each content dimension shown in a single post, column, or page must allow any subset of the elements (values) contained in the dimension to be shown in any order.
12. Unlimited dimension and number of aggregation levels - research on the possible number of necessary dimensions required in the analytical model showed that up to 19 dimensions can be used simultaneously. Hence, it is strongly recommended that the analytical tool be able to provide at least 15, and preferably 20, measurements simultaneously. Moreover, each of the common dimensions should not be limited in the number of user-analyst-defined aggregation levels and consolidation paths.
Codd's Additional Rules.
The set of these requirements, which served as the de facto definition of OLAP, quite often causes various complaints, for example, rules 1, 2, 3, 6 are requirements, and rules 10, 11 are unformalized wishes. Tokmakov G.P. Database. Database concept, relational data model, SQL languages. P. 68 Thus, Codd's listed 12 requirements do not allow us to accurately define OLAP. In 1995, Codd added the following six rules to the above list:
13. Batch Retrieval vs. Interpretation -- An OLAP system must provide access to both its own and external data equally effectively.
14. Support for all OLAP analysis models -- An OLAP system must support all four data analysis models defined by Codd: categorical, interpretative, speculative and stereotypical.
15. Processing of non-normalized data -- the OLAP system must be integrated with non-normalized data sources. Data modifications made in the OLAP environment should not result in changes to data stored in the original external systems.
16. Saving OLAP results: storing them separately from the source data - an OLAP system operating in read-write mode must save the results separately after modifying the source data. In other words, the security of the original data is ensured.
17. Elimination of missing values - An OLAP system, when presenting data to the user, must discard all missing values. In other words, missing values must be different from null values.
18. Handling Missing Values -- The OLAP system must ignore all missing values without regard to their source. This feature is related to the 17th rule.
In addition, Codd divided all 18 rules into the following four groups, calling them features. These groups were named B, S, R and D.
The main features of (B) include the following rules:
Multidimensional conceptual representation of data (rule 1);
Intuitive data manipulation (rule 10);
Availability (rule 3);
Batch extraction vs. interpretation (rule 13);
Support for all OLAP analysis models (rule 14);
Client-server architecture (rule 5);
Transparency (rule 2);
Multi-user support (rule 8)
Special Features (S):
Processing of non-normalized data (rule 15);
Storing OLAP results: storing them separately from the source data (rule 16);
Elimination of missing values (rule 17);
Handling missing values (rule 18). Reporting Features (R):
Flexibility of reporting (rule 11);
Standard reporting performance (rule 4);
Automatic physical layer configuration (modified original rule 7).
Dimension Control (D):
Universality of measurements (rule 6);
Unlimited number of dimensions and aggregation levels (rule 12);
Unlimited operations between dimensions (rule 9).
The concept of OLAP technology was formulated by Edgar Codd in 1993.
This technology is based on the construction of multidimensional data sets - so-called OLAP cubes (not necessarily three-dimensional, as one might conclude from the definition). The purpose of using OLAP technologies is to analyze data and present this analysis in a form convenient for management personnel to understand and make decisions based on them.
Basic requirements for applications for multivariate analysis:
- - providing the user with analysis results in an acceptable time (no more than 5 s);
- - multi-user access to data;
- - multidimensional data presentation;
- - the ability to access any information regardless of its storage location and volume.
OLAP system tools provide the ability to sort and select data according to specified conditions. Various qualitative and quantitative conditions can be specified.
The main data model used in numerous tools for creating and maintaining databases - DBMS - is the relational model. The data in it is presented in the form of a set of two-dimensional relation tables connected by key fields. To eliminate duplication, inconsistency, and reduce labor costs for maintaining databases, a formal apparatus for normalizing entity tables is used. However, its use is associated with additional time spent on generating responses to database queries, although memory resources are saved.
A multidimensional data model represents the object under study in the form of a multidimensional cube; a three-dimensional model is more often used. Dimensions or attribute details are plotted along the axes or faces of the cube. The base attributes are the filling of the cube cells. A multidimensional cube can be represented by a combination of three-dimensional cubes in order to facilitate perception and presentation when generating reporting and analytical documents and multimedia presentations based on analytical work materials in a decision support system.
Within the framework of OLAP technologies, based on the fact that a multidimensional representation of data can be organized both by means of relational DBMSs and multidimensional specialized tools, three types of multidimensional OLAP systems are distinguished:
- - multidimensional OLAP-MOLAP;
- - relational OLAP-ROLAP;
- - mixed or hybrid (Hibrid) OLAP-HOLAP.
In multidimensional DBMSs, data is organized not in the form of relational tables, but in the form of ordered multidimensional arrays in the form of hypercubes, when all stored data must have the same dimension, which means the need to form the maximum full basis measurements. Data can be organized in the form of polycubes; in this option, the values of each indicator are stored with its own set of dimensions, and data processing is carried out by the system’s own tool. The storage structure in this case is simplified, because there is no need for a data storage area in a multidimensional or object-oriented form. Huge labor costs for creating models and systems for converting data from a relational model to an object model are reduced.
The advantages of MOLAP are:
- - faster receipt of responses to requests than with ROLAP - the time spent is one or two orders of magnitude less;
- - SQL limitations make it difficult to implement many built-in functions.
Limitations of MOLAP include:
- - relatively small database sizes;
- - due to denormalization and pre-aggregation multidimensional arrays use 2.5-100 times more memory than the original data (memory consumption increases exponentially as the number of measurements increases);
- - there are no standards for the interface and means of data manipulation;
- - there are restrictions when loading data.
Labor costs for creating multidimensional data increase sharply, because... In this situation, there are practically no specialized means of objectifying the relational model of data contained in the information repository. Query response times often cannot meet the requirements for OLAP systems.
The advantages of ROLAP systems are:
- - the ability to quickly analyze the data directly contained in the warehouse, because most source databases are relational;
- - with a variable dimension of the problem, RO-LAP wins, because no physical reorganization of the database is required;
- - ROLAP systems can use less powerful client stations and servers, and the servers bear the main burden of processing complex SQL queries;
- - the level of information protection and differentiation of access rights in relational DBMSs is incomparably higher than in multidimensional ones.
The disadvantage of ROLAP systems is lower productivity, the need for careful development of database schemas, special tuning of indexes, analysis of query statistics and taking into account analysis findings when modifying database schemas, which leads to significant additional labor costs.
Fulfillment of these conditions allows, when using ROLAP systems, to achieve indicators similar to MOLAP systems in terms of access time, as well as surpass them in memory savings.
Hybrid OLAP systems are a combination of tools that implement a relational and multidimensional data model. This allows you to dramatically reduce the resource costs of creating and maintaining such a model and the response time to requests.
This approach uses the advantages of the first two approaches and compensates for their disadvantages. In the most developed software products For such purpose this principle is implemented.
The use of hybrid architecture in OLAP systems is the most appropriate way to solve problems associated with the use of software tools in multidimensional analysis.
The pattern detection mode is based on intelligent data processing. The main task here is to identify patterns in the processes under study, relationships and mutual influence of various factors, search for large “unusual” deviations, and predict the course of various significant processes. This area relates to data mining.
The OLAP mechanism is one of the popular methods of data analysis today. There are two main approaches to solving this problem. The first of them is called Multidimensional OLAP (MOLAP) - implementation of the mechanism using a multidimensional database on the server side, and the second Relational OLAP (ROLAP) - building cubes on the fly based on SQL queries to a relational DBMS. Each of these approaches has its pros and cons. Their comparative analysis is beyond the scope of this article. We will describe our implementation of the core of the desktop ROLAP module.
This task arose after using a ROLAP system built on the basis of Decision Cube components included in Borland Delphi. Unfortunately, the use of this set of components showed poor performance on large amounts of data. This problem can be mitigated by trying to cut out as much data as possible before feeding it into cubes. But this is not always enough.
You can find a lot of information about OLAP systems on the Internet and in the press, but almost nowhere is it said about how it works inside. Therefore, the solution to most problems was given to us by trial and error.
Scheme of work
The general scheme of operation of a desktop OLAP system can be represented as follows:
The operating algorithm is as follows:
- Receiving data in the form of a flat table or the result of executing an SQL query.
- Caching data and converting it to a multidimensional cube.
- Displaying the constructed cube using a crosstab or chart, etc. In general, an arbitrary number of views can be connected to one cube.
Let's consider how similar system can be arranged inside. We will start this from the side that can be seen and touched, that is, from the displays.
The displays used in OLAP systems most often come in two types: cross-tabs and charts. Let's look at a crosstab, which is the basic and most common way to display a cube.
Cross table
In the figure below, the rows and columns containing aggregated results are shown in yellow, the cells containing facts are in light gray, and the cells containing dimensional data are in dark gray.

Thus, the table can be divided into the following elements, which we will work with in the future:

When filling out the matrix with facts, we must proceed as follows:
- Based on the measurement data, determine the coordinates of the element to be added in the matrix.
- Determine the coordinates of the columns and rows of the totals that are affected by the added element.
- Add an element to the matrix and the corresponding total columns and rows.
It should be noted that the resulting matrix will be very sparse, which is why its organization in the form of a two-dimensional array (the option lying on the surface) is not only irrational, but, most likely, impossible due to the large dimension of this matrix, for storing which there is no no volume is enough random access memory. For example, if our cube contains information about sales for one year, and if it has only 3 dimensions - Customers (250), Products (500) and Date (365), then we will get a fact matrix of the following dimensions:
Number of elements = 250 x 500 x 365 = 45,625,000
And this despite the fact that there may be only a few thousand filled elements in the matrix. Moreover, the greater the number of dimensions, the more sparse the matrix will be.
Therefore, to work with this matrix, you need to use special mechanisms for working with sparse matrices. Various options for organizing a sparse matrix are possible. They are quite well described in the programming literature, for example, in the first volume of the classic book "The Art of Programming" by Donald Knuth.
Let us now consider how we can determine the coordinates of a fact, knowing the dimensions corresponding to it. To do this, let's take a closer look at the header structure:
In this case, you can easily find a way to determine the numbers of the corresponding cell and the totals in which it falls. Several approaches can be proposed here. One of them is to use a tree to find matching cells. This tree can be constructed by traversing the selection. In addition, an analytical recurrence formula can be easily defined to calculate the required coordinate.
Data preparation
The data stored in the table needs to be transformed in order to be used. Thus, in order to improve performance when constructing a hypercube, it is desirable to find unique elements stored in columns that are dimensions of the cube. In addition, you can perform preliminary aggregation of facts for records that have the same dimension values. As mentioned above, the unique values available in the measurement fields are important to us. Then the following structure can be proposed for storing them:

By using this structure, we significantly reduce the memory requirement. Which is quite relevant, because... To increase operating speed, it is advisable to store data in RAM. In addition, you can only store an array of elements, and dump their values to disk, since we will only need them when displaying the cross-tab.
CubeBase Component Library
The ideas described above were the basis for creating the CubeBase component library.

TCubeSource carries out caching and conversion of data into an internal format, as well as preliminary aggregation of data. Component TCubeEngine carries out calculations of the hypercube and operations with it. In fact, it is an OLAP engine that transforms a flat table into a multidimensional data set. Component TCubeGrid displays the cross-tab and controls the display of the hypercube. TCubeChart allows you to see the hypercube in the form of graphs, and the component TCubePivote controls the operation of the cube core.
Performance Comparison
This set of components showed much higher performance than Decision Cube. So, on a set of 45 thousand records, the Decision Cube components required 8 minutes. to build a pivot table. CubeBase loaded data in 7 seconds. and building a pivot table in 4 seconds. When testing on 700 thousand Decision Cube records, we did not receive a response within 30 minutes, after which we canceled the task. CubeBase loaded data in 45 seconds. and building a cube in 15 seconds.
On data volumes of thousands of records, CubeBase processed tens of times faster than Decision Cube. On tables with hundreds of thousands of records - hundreds of times faster. And high performance is one of the most important indicators of OLAP systems.
Purpose of the report
This report will focus on one of the categories of intelligent technologies that are a convenient analytical tool - OLAP technologies.
The purpose of the report: to reveal and highlight 2 issues: 1) the concept of OLAP and their applied importance in financial management; 2) implementation of OLAP functionality in software solutions: differences, opportunities, advantages, disadvantages.
I would like to note right away that OLAP is a universal tool that can be used in any application area, and not just in finance (as can be understood from the title of the report), which requires data analysis using various methods.
Financial management
Financial management is an area in which analysis is more important than any other. Any financial and management decision arises as a result of certain analytical procedures. Today, financial management is becoming important for the successful functioning of an enterprise. Despite the fact that financial management is an auxiliary process in an enterprise, it requires special attention, since erroneous financial and managerial decisions can lead to large losses.
Financial management is aimed at providing the enterprise with financial resources in the required volumes, at the right time and in the right place in order to obtain the maximum effect from their use through optimal distribution.
It is perhaps difficult to define the level of “maximum resource efficiency”, but in any case,
The CFO should always know:
- How many financial resources are available?
- Where will the funds come from and in what quantities?
- where to invest more effectively and why?
- and at what points in time does all this need to be done?
- how much is needed to ensure normal operation of the enterprise?
To obtain reasonable answers to these questions, it is necessary to have, analyze and know how to analyze a sufficiently large number of performance indicators. In addition, FU covers a huge number of areas: analysis of cash flows (movements Money), analysis of assets and liabilities, profitability analysis, marginal analysis, profitability analysis, assortment analysis.
Knowledge
Therefore, a key factor in the effectiveness of the financial management process is the availability of knowledge:
- Personal knowledge in the subject area (one might say theoretical and methodological), including experience, intuition of a financier/finance director
- General (corporate) knowledge or systematic information about the facts of financial transactions in an enterprise (i.e. information about the past, present and future state of the enterprise, presented in various indicators and measurements)
If the first lies in the scope of actions of this financier (or the HR director who hired this employee), then the second should be purposefully created at the enterprise by the joint efforts of employees of financial and information services.
What is there now
However, now a paradoxical situation is typical in enterprises: there is information, there is a lot of it, too much. But it is in a chaotic state: unstructured, inconsistent, fragmented, not always reliable and often erroneous, it is almost impossible to find and obtain. Long-term and often useless generation of mountains is carried out financial statements, which is inconvenient for financial analysis and difficult to understand, since it is not created for internal management, but for provision to external regulatory authorities.
According to the results of a study conducted by the company Reuters Among 1,300 international managers, 38% of respondents say they spend a lot of time trying to find the information they need. It turns out that a highly qualified specialist spends highly paid time not on data analysis, but on collecting, searching and systematizing the information necessary for this analysis. At the same time, managers are overloaded with data that is often irrelevant, which again reduces the effectiveness of their work. The reason for this situation: excess information and lack of knowledge.
What to do
Information must be turned into knowledge. For modern business, valuable information, its systematic acquisition, synthesis, exchange, use is a kind of currency, but in order to receive it, it is necessary to manage information, like any business process.
The key to information management is delivering the right information in the right form to stakeholders within the organization at the right time. The goal of such management is to help people work better together using increasing amounts of information.
Information technology in this case acts as a means by which it would be possible to systematize information in an enterprise, provide certain users with access to it and give them the tools to transform this information into knowledge.
Basic concepts of OLAP technologies
OLAP technologies (from the English On-Line Analytical Processing) is the name not of a specific product, but of an entire technology for the operational analysis of multidimensional data accumulated in a warehouse. In order to understand the essence of OLAP, it is necessary to consider the traditional process of obtaining information for decision making.
Traditional decision support system
Here, of course, there can also be many options: complete information chaos or the most typical situation when the enterprise has operational systems with the help of which the facts of certain operations are recorded and stored in databases. To extract data from databases for analytical purposes, a system of queries for specific data samples has been built.
But this method of decision support lacks flexibility and has many disadvantages:
- negligible amount of data is used that can be useful for decision making
- sometimes complex multi-page reports are created, of which 1-2 lines are actually used (the rest is just in case) - information overload
- slow response of the process to changes: if a new data representation is needed, the request must be formally described and coded by the programmer, only then executed. Waiting time: hours, days. Or perhaps a solution is needed now, immediately. But after receiving new information, a new question will arise (clarifying)
If query reports are presented in a one-dimensional format, then business problems are usually multidimensional and multifaceted. If you want to get a clear picture of a company's business, then you need to analyze data from various perspectives.
Many companies create excellent relational databases data, ideally sorting out mountains of unused information, which in itself does not provide either a quick or sufficiently competent reaction to market events. YES - relational databases were, are and will be the most suitable technology for storing corporate data. It's not about new technology DB, but rather about analysis tools that complement the functions of existing DBMSs and are flexible enough to provide and automate different types intellectual analysis inherent in OLAP.
Understanding OLAP
What does OLAP provide?
- Advanced storage data access tools
- Dynamic interactive data manipulation (rotation, consolidation or drill-down)
- Clear visual display of data
- Fast – analysis is carried out in real time
- Multidimensional data presentation - simultaneous analysis of a number of indicators along several dimensions
To get the effect of using OLAP technologies, you must: 1) understand the essence of the technologies themselves and their capabilities; 2) clearly define what processes need to be analyzed, what indicators they will be characterized by and in what dimensions it is advisable to see them, i.e. create an analysis model.
The basic concepts that OLAP technologies operate on are as follows:
Multidimensionality
To understand the multidimensionality of the data, you should first present a table showing, for example, the performance of Enterprise Costs by economic elements and business units.
This data is presented in two dimensions:
- article
- business unit
This table is not informative, as it shows sales for one specific period of time. For different time periods, analysts will have to compare several tables (for each time period):

The figure shows a 3rd dimension, Time, in addition to the first two. (Article, business unit)
Another way to show multidimensional data is to represent it in the form of a cube:


OLAP cubes allow analysts to obtain data at various slices to obtain answers to questions posed by the business:
- Which costs are critical in which business units?
- How do business unit costs change over time?
- How do cost items change over time?
Answers to such questions are necessary for making management decisions: on the reduction of certain cost items, the impact on their structure, identifying the reasons for changes in costs over time, deviations from the plan and their elimination - optimizing their structure.
In this example, only 3 dimensions are considered. It's difficult to depict more than 3 dimensions, but it works in the same way as with 3 dimensions.
Typically, OLAP applications allow you to obtain data on 3 or more dimensions, for example, you can add one more dimension - Plan-Actual, Cost Category: direct, indirect, by Orders, by Months. Additional dimensions allow you to obtain more analytical slices and provide answers to questions with multiple conditions.
Hierarchy
OLAP also allows analysts to organize each dimension into a hierarchy of groups, subgroups, and totals that reflect the measure across the entire organization—the most logical way to analyze a business.
For example, it is advisable to group costs hierarchically:
OLAP allows analysts to look at the overall summary metric (at the top level) and then drill down to the bottom and subsequent levels to discover the exact reason why the metric changed.
By allowing analysts to use multiple dimensions in a data cube, with the ability to hierarchically construct dimensions, OLAP provides a picture of the business that is not compressed by the information warehouse structure.
Changing directions of analysis in a cube (rotating data)
As a rule, they operate in concepts: dimensions specified in columns, rows (there may be several of them), the rest form slices, the contents of the table form dimensions (sales, costs, cash)
Typically, OLAP allows you to change the orientation of cube dimensions, thereby presenting the data in different views.
The display of cube data depends on:
- dimension orientations: which dimensions are specified in rows, columns, slices;
- groups of indicators, highlighted in rows, columns, sections.
- Changing dimensions is within the scope of the user's actions.

Thus, OLAP allows you to carry out various types of analysis and understand their relationships with their results.
- Deviation analysis is an analysis of plan implementation, which is supplemented by factor analysis of the causes of deviations by detailing the indicators.
- Dependency analysis: OLAP allows you to identify various dependencies between various changes, for example, when beer was removed from the assortment during the first two months, a drop in roach sales was discovered.
- Comparison (comparative analysis). Comparison of the results of changes in an indicator over time, for a given group of goods, in different regions, etc.
- Analysis of dynamics allows us to identify certain trends in changes in indicators over time.
Efficiency: we can say that OLAP is based on the laws of psychology: the ability to process information requests in “real time” - at the pace of the process of analytical comprehension of data by the user.
If a relational database can read about 200 records per second and write 20, then a good OLAP server, using calculated rows and columns, can consolidate 20,000-30,000 cells (equivalent to one record in a relational database) per second.
Visibility: It should be emphasized that OLAP provides advanced means of graphical presentation of data to the end user. The human brain is capable of perceiving and analyzing information that is presented in the form of geometric images, in a volume that is several orders of magnitude greater than information presented in alphanumeric form. Example: Let's say you need to find a familiar face in one of a hundred photographs. I believe this process will take you no more than a minute. Now imagine that instead of photographs you will be offered a hundred verbal descriptions of the same persons. I think that you will not be able to solve the proposed problem at all.
Simplicity: The main feature of these technologies is that they are intended for use by non-specialists in the field information technologies, not an expert statistician, but a professional in the applied field - a credit department manager, a budget department manager, and finally a director. They are designed for the analyst to communicate with the problem, not with the computer..
Despite the great capabilities of OLAP (in addition, the idea is relatively old - the 60s), its actual use is practically never found in our enterprises. Why?
- there is no information or the possibilities are not clear
- habit of thinking two-dimensionally
- price barrier
- excessive technological content of articles devoted to OLAP: unusual terms are frightening - OLAP, “data mining and slicing”, “ad hoc queries”, “identification of significant correlations”
Our approach and Western ones to the use of OLAP
In addition, we also have a specific understanding of the application utility of OLAP even while understanding its technological capabilities.
Our and Russian authors of various materials devoted to OLAP express the following opinion regarding the usefulness of OLAP: most perceive OLAP as a tool that allows you to expand and collapse data simply and conveniently, carrying out the manipulations that come to the analyst’s mind during the analysis process. The more “slices” and “sections” of data the analyst sees, the more ideas he has, which, in turn, require more and more “slices” for verification. It is not right.
The Western understanding of the usefulness of OLAP is based on a methodological analysis model that must be incorporated when designing OLAP solutions. The analyst should not play with the OLAP cube and aimlessly change its dimensions and levels of detail, data orientation, graphical display of data (and this really takes!), but clearly understand what views he needs, in what sequence and why (of course, the elements " there may be discoveries here, but it is not fundamental to the usefulness of OLAP).
Applications of OLAP
- Budget
- Flow of funds
One of the most fertile areas of application of OLAP technologies. It is not for nothing that no modern budgeting system is considered complete without the presence of OLAP tools for budget analysis. Most budget reports are easily built on the basis of OLAP systems. At the same time, the reports answer a very wide range of questions: analysis of the structure of expenses and income, comparison of expenses for certain items in different divisions, analysis of the dynamics and trends of expenses for certain items, analysis of costs and profits.
OLAP will allow you to analyze cash inflows and outflows in the context of business operations, counterparties, currencies and time in order to optimize their flows.
- Financial and management reporting (with analytics that management needs)
- Marketing
- Balanced Scorecard
- Profitability Analysis
If you have the appropriate data, you can find various applications of OLAP technology.
OLAP products
This section will discuss OLAP as a software solution.
General requirements for OLAP products
There are many ways to implement OLAP applications, so no particular technology should have been required, or even recommended. Under different conditions and circumstances, one approach may be preferable to another. The implementation techniques include many different proprietary ideas that vendors are so proud of: variations of client-server architecture, time series analysis, object orientation, data storage optimization, parallel processes, etc. But these technologies cannot be part of the definition of OLAP.
There are characteristics that must be observed in all OLAP products (if it is an OLAP product), which is the ideal of the technology. These are the 5 key definitions that characterize OLAP (the so-called FASMI test): Fast Analysis of Shared Multidimensional Information.
- Fast(FAST) means that the system should be able to provide most responses to users within approximately five seconds. Even if the system warns that the process will take significantly longer, users may become distracted and lose their thoughts, and the quality of the analysis will suffer. This speed is not easy to achieve with large amounts of data, especially if special on-the-fly calculations are required. Vendors resort to a wide variety of methods to achieve this goal, including specialized forms of data storage, extensive pre-computing, or increasingly stringent hardware requirements. However, there are currently no fully optimized solutions. At first glance, it may seem surprising that when receiving a report in a minute that not so long ago took days, the user very quickly becomes bored while waiting, and the project turns out to be much less successful than in the case of an instant response, even at the cost of less detailed analysis.
- Shared means that the system makes it possible to fulfill all data protection requirements and implement distributed and simultaneous access to data for different levels of users. The system must be able to handle multiple data changes in a timely, secure manner. This is a major weakness of many OLAP products, which tend to assume that all OLAP applications are read-only and provide simplified security controls.
- Multidimensional is a key requirement. If you had to define OLAP in one word, you would choose it. The system must provide a multi-dimensional conceptual view of data, including full support for hierarchies and multiple hierarchies, as this determines the most logical way to analyze the business. There is no minimum number of dimensions that must be processed, as this also depends on the application, and most OLAP products have a sufficient number of dimensions for the markets they are aimed at. Again, we do not specify what underlying database technology should be used if the user is to obtain a truly multidimensional conceptual view of the information. This feature is the heart of OLAP
- Information. The necessary information must be obtained where it is needed, regardless of its volume and storage location. However, a lot depends on the application. The power of various products is measured in terms of how much input data they can process, but not how many gigabytes they can store. The power of the products varies widely - the largest OLAP products can handle at least a thousand times more data than the smallest. There are many factors to consider in this regard, including data duplication, RAM requirements, disk space usage, performance metrics, integration with information warehouses, etc.
- Analysis means that the system can handle any logical and statistical analysis specific to a given application and ensures that it is stored in a form accessible to the end user. The user should be able to define new custom calculations as part of the analysis without the need for programming. That is, all required analysis functionality must be provided in an intuitive way for end users. Analysis tools could include certain procedures, such as time series analysis, cost allocation, currency transfers, target searches, etc. Such capabilities vary widely among products, depending on the target orientation.
In other words, these 5 key definitions are the goals that OLAP products are designed to achieve.
Technological aspects of OLAP
An OLAP system includes certain components. There are various schemes for their operation that this or that product can implement.
Components of OLAP systems (what does an OLAP system consist of?)
Typically, an OLAP system includes the following components:
- Data source
The source from which data for analysis is taken (data warehouse, database of operational accounting systems, set of tables, combinations of the above). - OLAP server
Data from the source is transferred or copied to the OLAP server, where it is systematized and prepared for faster generation of responses to queries. - OLAP client
User interface to the OLAP server in which the user operates
It should be noted that not all components are required. There are desktop OLAP systems that allow you to analyze data stored directly on the user's computer and do not require an OLAP server.
However, what element is required is the data source: data availability is an important issue. If they exist, in any form, such as an Excel table, in the accounting system database, or in the form of structured reports from branches, the IT specialist will be able to integrate with the OLAP system directly or with intermediate conversion. OLAP systems have special tools for this. If this data is not available, or it is of insufficient completeness and quality, OLAP will not help. That is, OLAP is only a superstructure over the data, and if there is none, it becomes a useless thing.
Most data for OLAP applications originates in other systems. However, in some applications (for example, planning or budgeting), data can be created directly in OLAP applications. When data comes from other applications, it is usually necessary for the data to be stored in a separate, duplicate form for the OLAP application. Therefore, it is advisable to create data warehouses.
It should be noted that the term “OLAP” is inextricably linked with the term “data warehouse” (Data Warehouse). A data warehouse is a domain-specific, time-based, and immutable collection of data to support management decision-making. Data in the warehouse comes from operational systems (OLTP systems), which are designed to automate business processes; the warehouse can be replenished from external sources, for example, statistical reports.
Despite the fact that they contain obviously redundant information that is already in databases or operating system files, data warehouses are necessary because:
- fragmentation of data, storing it in various DBMS formats;
- data retrieval performance improves
- if in an enterprise all data is stored on a central database server (which is extremely rare), the analyst will probably not understand their complex, sometimes confusing structures
- complex analytical queries for operational information slow down the current work of the company, blocking tables for a long time and taking over server resources
- ability to clean and harmonize data
- it is impossible or very difficult to directly analyze data from operating systems;
The purpose of the repository is to provide the “raw material” for analysis in one place and in a simple, understandable structure. That is, the concept of Data Warehousing is not a concept of data analysis, rather it is a concept of preparing data for analysis. It involves the implementation of a single integrated data source.
OLAP products: architectures
When using OLAP products, two questions are important: how and where keep And process data. Depending on how these two processes are implemented, OLAP architectures are distinguished. There are 3 ways to store data for OLAP and 3 ways to process this data. Many manufacturers offer several options, some try to prove that their approach is the single most prudent one. This is, of course, absurd. However, very few products can operate in more than one mode efficiently.
OLAP data storage options
Storage in this context means keeping data in a constantly updated state.
- Relational databases: This is a typical choice if an enterprise stores accounting data in a RDB. In most cases, data should be stored in a denormalized structure (the most suitable is a star schema). A normalized database is not acceptable due to the very low query performance when generating aggregates for OLAP (often the resulting data is stored in aggregate tables).
- Database files on the client computer (kiosks or data marts): This data can be pre-distributed or created by queries on client computers.
Multidimensional databases: assume that data is stored in a multidimensional database on a server. It can include data extracted and summarized from other systems and relational databases, end-user files, etc. In most cases, multidimensional databases are stored on disk, but some products allow you to use RAM, calculating the most frequently used data on the fly " Very few products based on multidimensional databases allow multiple editing of data; many products allow single editing but multiple readings of data, while others are limited to reading only.
These three storage locations have different storage capabilities, and they are arranged in descending order of capacity. They also have different query performance characteristics: relational databases are much slower than the latter two options.
Options for processing OLAP data
There are 3 of the same data processing options:
- Using SQL: This option is, of course, used when storing data in a RDB. However, SQL does not allow multidimensional calculations in a single query, so it requires writing complex SQL queries to achieve more than basic multidimensional functionality. However, this doesn't stop developers from trying. In most cases, they perform a limited number of relevant calculations in SQL, with results that can be obtained from multidimensional data processing or from the client machine. It is also possible to use RAM that can store data using more than one request: this dramatically improves response.
- Multidimensional processing on the client: The client OLAP product does the calculations itself, but such processing is only available if users have relatively powerful PCs.
Server-side multidimensional processing: This is a popular place to perform multidimensional calculations in client-server OLAP applications and is used in many products. Performance is usually high because most of the calculations have already been done. However, this requires a lot of disk space.
Matrix of OLAP architectures
Accordingly, by combining storage/processing options, it is possible to obtain a matrix of OLAP system architectures. Accordingly, theoretically there can be 9 combinations of these methods. However, since 3 of them lack common sense, in reality there are only 6 options for storing and processing OLAP data.
|
Multidimensional storage options Options |
Relational database |
Server-side multidimensional database |
Client computer |
|
Cartesis Magnitude |
|||
|
Multidimensional server processing |
Crystal Holos (ROLAP mode) IBM DB2 OLAP Server CA EUREKA:Strategy Informix MetaCube Speedware Media/MR Microsoft Analysis Services Oracle Express (ROLAP mode) Pilot Analysis Server Applix iTM1 |
Crystal Holos Comshare Decision Hyperion Essbase Oracle Express Speedware Media/M Microsoft Analysis Services PowerPlay Enterprise Server Pilot Analysis Server Applix iTM1 |
|
|
Multidimensional processing on the client computer |
Oracle Discoverer Informix MetaCube |
Dimensional Insight Hyperion Enterprise |
Cognos PowerPlay Personal Express iTM1 Perspectives |
Since it is storage that determines processing, it is customary to group by storage options, that is:
- ROLAP products in sectors 1, 2, 3
- Desktop OLAP - in sector 6
MOLAP products – in sectors 4 and 5
HOLAP products (allowing both multidimensional and relational data storage options) – in 2 and 4 (in italics)
Categories of OLAP products
There are more than 40 OLAP vendors, although they cannot all be considered competitors because their capabilities are very different and, in fact, they operate in different market segments. They can be grouped into 4 fundamental categories, the differences between which are based on the following concepts: complex functionality - simple functionality, performance - disk space. It is useful to depict categories in the shape of a square because it clearly shows the relationships between them. The distinctive feature of each category is represented on its side, and the similarities with others are represented on the adjacent sides, therefore, the categories on opposite sides are fundamentally different.
|
Peculiarities |
Advantages |
Flaws |
Representatives |
|
|
Applied OLAP |
Complete applications with rich functionality. Almost all require a multidimensional database, although some work with a relational one. Many of this category of applications are specialized, such as sales, manufacturing, banking, budgeting, financial consolidation, sales analysis |
Possibility of integration with various applications High level of functionality High level of flexibility and scalability |
Application complexity (user training required) High price |
Hyperion Solutions Crystal Decisions Information Builders |
|
The product is based on a non-relational data structure that provides multidimensional storage, processing and presentation of data. During the analysis process, data is selected exclusively from a multidimensional structure. Despite the high level of openness, suppliers persuade buyers to purchase their own tools |
High performance (fast calculations of summary indicators and various multidimensional transformations for any of the dimensions). The average response time to an ad hoc analytical query when using a multidimensional database is usually 1-2 orders of magnitude less than in the case of an RDB High level of openness: a large number of products with which integration is possible They easily cope with the tasks of including various built-in functions in the information model, carrying out specialized analysis by the user, etc. |
The need for large disk space to store data (due to redundancy of data that is stored). This is an extremely inefficient use of memory - due to denormalization and pre-executed aggregation, the volume of data in a multidimensional database corresponds to 2.5-100 times less than the volume of the original detailed data. In any case, MOLAP does not allow you to work with large databases data. The real limit is a database of 10-25 gigabytes The potential for a database “explosion” is an unexpected, sharp, disproportionate increase in its volume Lack of flexibility when it comes to modifying data structures. Any change in the structure of dimensions almost always requires a complete restructuring of the hypercube For multidimensional databases, there are currently no uniform standards for the interface, languages for describing and manipulating data |
Hyperion (Essbase) |
|
|
DOLAP (Desktop OLAP) |
Client OLAP products that are fairly easy to implement and have a low cost per seat We are talking about such analytical processing where hypercubes are small, their dimension is small, the needs are modest, and for such analytical processing a personal machine on a desktop is sufficient The goal of the producers of this market is to automate hundreds and thousands of jobs, but users must perform a fairly simple analysis. Buyers are often encouraged to buy more jobs than necessary |
Good integration with databases: multidimensional, relational Possibility of making complex purchases, which reduces the cost of implementation projects Ease of use of applications |
Very limited functionality (not comparable in this regard with specialized products) Very limited power (small data volumes, small number of measurements) |
Cognos (PowerPlay) Business Objects Crystal Decisions |
|
This is the smallest sector of the market. Detailed data remains where it was originally - in the relational database; some aggregates are stored in the same database in specially created service tables |
Capable of handling very large amounts of data (cost-effective storage) Provide a multi-user mode of operation, including editing mode, and not just reading Higher level of data protection and good options for differentiating access rights Frequent changes to the measurement structure are possible (do not require physical reorganization of the database) |
Low performance, significantly inferior in terms of response speed to multidimensional ones (response to complex queries measured in minutes or even hours rather than seconds). These are better report builders than interactive analytics tools Complexity of products. Requires significant maintenance costs from information technology specialists. To provide performance comparable to MOLAP, relational systems require careful design of the database schema and configuration of indexes, that is, a lot of effort on the part of database administrators Expensive to implement The limitations of SQL remain a reality, which prevents the implementation in RDBMS of many built-in functions that are easily provided in systems based on a multidimensional representation of data |
Information Advantage Informix (MetaCube) |
It should be noted that consumers of hybrid products that allow the choice of ROLAP and MOLAP mode, such as Microsoft Analysis Services, Oracle Express, Crystal Holos, IBM DB2 OLAPServer, almost always select MOLAP mode.
Each of the presented categories has its own strengths and weaknesses, there is no one optimal choice. The choice affects 3 important aspects: 1) performance; 2) disk space for data storage; 3) capabilities, functionality and especially the scalability of the OLAP solution. In this case, it is necessary to take into account the volume of data being processed, the power of the equipment, the needs of users and seek a compromise between speed and redundancy of disk space occupied by the database, simplicity and versatility.
Classification of Data Warehouses in accordance with the volume of the target database
Disadvantages of OLAP
Like any technology, OLAP also has its drawbacks: high requirements for hardware, training and knowledge of administrative personnel and end users, high costs for the implementation of the implementation project (both monetary and time, intellectual).
Selecting an OLAP product
Choosing the right OLAP product is difficult, but very important if you want the project to not fail.
As you can see, product differences lie in many areas: functional, architectural, technical. Some products are very limited in settings. Some are created for specialized subject areas: marketing, sales, finance. There are products for general purposes, which do not have an application specific use, which must be quite flexible. As a rule, such products are cheaper than specialized ones, but the implementation costs are higher. The range of OLAP products is very wide - from the simplest tools for building pivot tables and charts that are part of office products, to tools for analyzing data and searching for patterns, which cost tens of thousands of dollars.
As in any other field, in the field of OLAP there cannot be clear guidelines for choosing tools. You can only focus on a number of key points and compare the proposed software capabilities with the needs of the organization. One thing is important: without properly thinking about how you are going to use OLAP tools, you risk creating a huge headache for yourself.
During the selection process, there are 2 questions to consider:
- assess the needs and capabilities of the enterprise
- evaluate the existing offer on the market, development trends are also important
Then compare all this and, in fact, make a choice.
Needs assessment
You can't make a rational product choice without understanding what it will be used for. Many companies want the “best possible product” without a clear understanding of how it should be used.
In order for the project to be successfully implemented, the financial director must, at a minimum, competently formulate his wishes and requirements to the manager and automation service specialists. Many problems arise due to insufficient preparation and awareness for the choice of OLAP; IT specialists and end users experience communication difficulties simply because they manipulate different concepts and terms during conversation and put forward conflicting preferences. There needs to be consistency in goals within the company.
Some factors have already become obvious after reading the overview of OLAP product categories, namely:
Technical aspects
- Data sources: corporate data warehouse, OLTP system, table files, relational databases. Possibility of linking OLAP tools with all DBMS used in the organization. As practice shows, the integration of heterogeneous products into a stable operating system is one of the most important issues, and its solution in some cases can be associated with big problems. It is necessary to understand how simply and reliably it is possible to integrate OLAP tools with the DBMS existing in the organization. It is also important to evaluate the possibilities of integration not only with data sources, but also with other applications to which you may need to export data: email, office applications
- Variability of data taken into account
- Server platform: NT, Unix, AS/400, Linux - but don't insist that OLAP specification products run on questionable or dying platforms you're still using
- Client-side and browser standards
- Deployable architecture: the local network and PC modem connection, high-speed client/server, intranet, extranet, Internet
- International Features: Multi-currency support, multi-lingual operations, data sharing, localization, licensing, Windows update
Amounts of input information that are available and that will appear in the future
Users
- Area of application: sales/marketing analysis, budgeting/planning, performance analysis, accounting report analysis, qualitative analysis, financial condition, generation of analytical materials (reports)
- Number of users and their location, requirements for the division of access rights to data and functions, secrecy (confidentiality) of information
- User type: senior management, finance, marketing, HR, sales, production, etc.
- User experience. User skill level. Consider providing training. It is very important that the OLAP client application is designed so that users feel confident and can use it effectively.
Key Features: Data Writeback Needs, Distributed Computing, Complex Currency Conversions, Report Printing Needs, Spreadsheet Interface, Application Logic Complexity, Dimensions Required, Analysis Types: Statistical, Goal Search, What-If Analysis
Implementation
- Who will be involved in implementation and operation: external consultants, internal IT function or end users
- Budget: software, hardware, services, data transmission. Remember that paying for OLAP product licenses is only a small part of the total cost of the project. Implementation and hardware costs may be more than the license fee, and long-term support, operation, and administration costs are almost certainly significantly more. And if you make the wrong decision to buy the wrong product just because it's cheaper, you may end up with a higher overall project cost due to higher maintenance, administration and/or hardware costs for what you'll likely get more low level business benefits. When estimating total costs, be sure to ask the following questions: How broad are the sources of implementation, training, and support available? Is the potential general fund (employees, contractors, consultants) likely to grow or shrink? How widely can you use your industrial professional experience?
Despite the fact that the cost of analytical systems remains quite high even today, and the methodologies and technologies for implementing such systems are still in their infancy, today the economic effect they provide significantly exceeds the effect of traditional operational systems.
The effect of proper organization, strategic and operational planning of business development is difficult to quantify in advance, but it is obvious that it can exceed the costs of implementing such systems by tens and even hundreds of times. However, one should not be mistaken. The effect is ensured not by the system itself, but by the people working with it. Therefore, declarations like: “a system of Data Warehousing and OLAP technologies will help the manager make the right decisions” are not entirely correct.” Modern analytical systems are not artificial intelligence systems and they can neither help nor hinder decision making. Their goal is to promptly provide the manager with all the information necessary to make a decision in a convenient form. And what information will be requested and what decision will be made based on it depends only on the specific person using it.
All that remains to be said is that these systems can help solve many business problems and can have far-reaching positive effects. It remains to be seen who will be the first to realize the benefits of this approach and be ahead of the others.
OLAP(from the English OnLine Analytical Processing - operational analytical data processing, also: analytical data processing in real time, interactive analytical data processing) - an approach to analytical data processing based on their multidimensional hierarchical representation, which is part of the broader field of information technology - business -analysts ().
For a catalog of OLAP solutions and projects, see the OLAP section on TAdviser.
From the user's point of view, OLAP-systems provide tools for flexible viewing of information in various sections, automatic receipt of aggregated data, performing analytical operations of convolution, detailing, and comparison over time. All this makes OLAP systems a solution with obvious advantages in the field of data preparation for all types of business reporting, involving the presentation of data in various sections and different levels of hierarchy - for example, sales reports, various forms of budgets, and so on. The advantages of such a representation in other forms of data analysis, including forecasting, are obvious.
Requirements for OLAP systems. FASMI
The key requirement for OLAP systems is speed, which allows them to be used in the process of an analyst’s interactive work with information. In this sense, OLAP systems are contrasted, firstly, with traditional RDBMS, samples from which with typical queries for analysts using grouping and aggregation of data are usually expensive in terms of waiting time and loading of the RDBMS, so interactive work with them for any significant volumes data is complex. Secondly, OLAP systems are also opposed to the usual flat-file presentation of data, for example, in the form of frequently used traditional spreadsheets, the presentation of multidimensional data in which is complex and not intuitive, and operations for changing the slice - points of view on the data - also require time and complicate interactive work with data.
At the same time, on the one hand, data requirements specific to OLAP systems usually imply storing data in special structures optimized for typical OLAP tasks; on the other hand, directly extracting data from existing systems during the analysis process would lead to a significant drop in their performance.
Therefore, an important requirement is to ensure the most flexible import-export link between existing systems, acting as a data source and an OLAP system, as well as an OLAP system and external data analysis and reporting applications.
Moreover, such a combination must satisfy the obvious requirements of supporting import-export from several data sources, implementing procedures for cleaning and transforming data, unifying the used classifiers and reference books. In addition to these requirements is added the need to take into account various data update cycles in existing information systems and unification of the required level of data detail. The complexity and versatility of this problem led to the emergence of the concept of data warehouses, and, in a narrow sense, to the identification of a separate class of data conversion and transformation utilities - ETL (Extract Transform Load).
Active Data Storage Models
We indicated above that OLAP assumes a multidimensional hierarchical representation of data, and, in a sense, is opposed to RDBMS-based systems.
This, however, does not mean that all OLAP systems use a multidimensional model to store active, “working” system data. Since the active data storage model influences all requirements dictated by the FASMI test, its importance is emphasized by the fact that it is on this basis that OLAP subtypes are traditionally distinguished - multidimensional (MOLAP), relational (ROLAP) and hybrid (HOLAP).
However, some experts, led by the aforementioned Nigel Pends, indicate that classification based on one criterion is not complete enough. Moreover, the vast majority of existing OLAP systems will relate to hybrid type. Therefore, we will dwell in more detail on active data storage models, mentioning which of them correspond to which of the traditional OLAP subtypes.
Storing active data in a multidimensional database
In this case, OLAP data is stored in multidimensional DBMSs that use designs optimized for this type of data. Typically, multidimensional DBMSs support all typical OLAP operations, including aggregation along the required hierarchy levels and so on.
This type of data storage, in a sense, can be called classic for OLAP. However, all steps for preliminary data preparation are fully necessary for it. Typically, multidimensional DBMS data is stored on disk, however, in some cases, to speed up data processing, such systems allow data to be stored in RAM. For the same purposes, storing pre-calculated aggregate values and other calculated values in the database is sometimes used.
Multidimensional DBMSs that fully support multi-user access with competing read and write transactions are quite rare; the usual mode for such DBMSs is single-user with write access with multi-user read access, or multi-user read-only.
Among the shortcomings characteristic of some implementations of multidimensional DBMSs and OLAP systems based on them, one can note their susceptibility to an unpredictable growth in the amount of space occupied by the database from a user point of view. This effect is caused by the desire to minimize the reaction time of the system, which dictates storing pre-calculated values of aggregate indicators and other quantities in the database, which causes a nonlinear increase in the volume of information stored in the database with the addition of new data values or measurements.
The extent to which this problem manifests itself, as well as the related problems of efficiently storing sparse data cubes, is determined by the quality of the approaches and algorithms used for specific implementations of OLAP systems.
Storing active data in a relational database
OLAP data can also be stored in a traditional RDBMS. In most cases, this approach is used when trying to “painlessly” integrate OLAP with existing accounting systems or RDBMS-based data warehouses. At the same time, this approach requires some additional capabilities from the RDBMS to ensure effective fulfillment of the requirements of the FASMI test (in particular, ensuring minimal system response time). Typically, OLAP data is stored in denormalized form, and some of the pre-calculated aggregates and values are stored in special tables. When stored in a normalized form, the effectiveness of RDBMS as a method for storing active data decreases.
The problem of choosing effective approaches and algorithms for storing precomputed data is also relevant for OLAP systems based on RDBMS, so manufacturers of such systems usually focus on the merits of the approaches used.
In general, it is believed that RDBMS-based OLAP systems slower systems, based on multidimensional DBMSs, including due to data storage structures that are less efficient for OLAP tasks, but in practice this depends on the characteristics of a particular system.
Among the advantages of storing data in an RDBMS is the greater scalability of such systems.
Storing active data in flat files
This approach involves storing chunks of data in regular files. It is usually used as an addition to one of the two main approaches in order to speed up work by caching current data on disk or in the RAM of the client PC.
Hybrid approach to data storage
Most manufacturers of OLAP systems that promote their comprehensive solutions, often including, in addition to the OLAP system itself, DBMS, ETL (Extract Transform Load) and reporting tools, currently use a hybrid approach to organizing the storage of active system data, distributing it in one way or another between RDBMS and specialized storage, as well as between disk structures and in-memory caching.
Since the effectiveness of such a solution depends on the specific approaches and algorithms used by the manufacturer to determine whether what data and where to store, then hastily draw conclusions about the initially greater efficiency of such solutions as a class without assessing the specific features of the system under consideration.
OLAP(eng. on-line analytical processing) – a set of methods for dynamic processing of multidimensional queries in analytical databases. Such data sources are usually quite large, and one of the most important requirements in the tools used to process them is high speed. In relational databases, information is stored in separate tables that are well normalized. But complex multi-table queries are executed quite slowly in them. Much best performance processing speed in OLAP systems is achieved due to the peculiarities of the data storage structure. All information is clearly organized, and two types of data storage are used: measurements(contain directories divided into categories, for example, points of sale, clients, employees, services, etc.) and data(characterize the interaction of elements various measurements, for example, on March 3, 2010, seller A provided a service to customer B in store C for the amount of D monetary units). Measures are used to calculate results in the Analysis Cube. Measures are collections of facts aggregated by corresponding selected dimensions and their elements. Thanks to these features, complex queries with multidimensional data take much less time than with relational sources.
One of the main vendors of OLAP systems is Microsoft Corporation. Let's look at the implementation of OLAP principles using practical examples of creating an analytical cube in the Microsoft SQL Server Business Intelligence Development Studio (BIDS) and Microsoft Office PerformancePoint Server Planning Business Modeler (PPS) applications and get acquainted with the possibilities of visually representing multidimensional data in the form of graphs, charts and tables.
For example, in BIDS it is necessary to create an OLAP cube using data about an insurance company, its employees, partners (clients) and points of sale. Let's assume that the company provides one type of service, so measurement of services will not be needed.
First let's define the measurements. The following entities (data categories) are associated with the company’s activities:
- Points of sale
- Employees
- Partners
Next, you need one table to store facts (fact table).
Information can be entered into tables manually, but the most common way is to load data using the Import Wizard from various sources.
The following figure shows the flow of manually creating and populating dimension and fact tables:
Fig.1. Tables of dimensions and facts in the analytical database. Creation sequence
After creating a multidimensional data source in BIDS, you can view its presentation (Data Source View). In our example, we will get the circuit shown in the figure below.
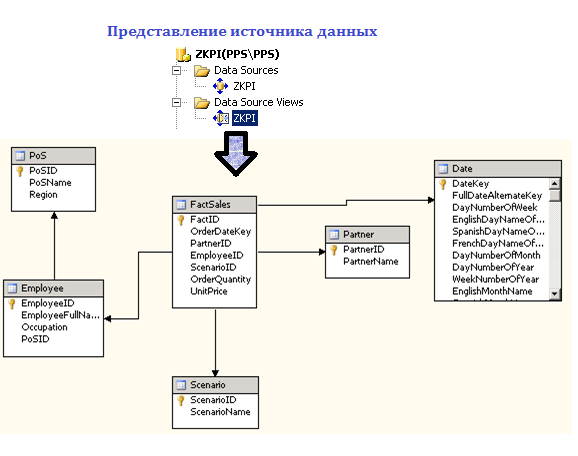
Fig.2. Data Source View in Business Intelligence Development Studio (BIDS)
As you can see, the fact table is connected to the dimension tables through a one-to-one correspondence of identifier fields (PartnerID, EmployeeID, etc.).
Let's look at the result. On the cube explorer tab, by dragging measures and dimensions into the totals, rows, columns and filters fields, we can get a view of the data of interest (for example, concluded transactions on insurance contracts concluded by a certain employee in 2005).
-
 April 17, 2015Connection to the earth's information field
 -
 April 17, 2015Connecting a hard drive via USB, step-by-step instructions
 -
 April 17, 2015Android won't save to microSD card


